One minute registration and you are already investing
Two weeks free access to all features
We support thousands of stocks, bonds, funds and cryptocurrencies
5 brokers
We support loading reports from 5 different brokers. There is also automatic integration with Tinkoff API
60+ exchanges
You can add assets from all over the world. We support major exchanges.
Real estate and deposits
Add any assets that are not traded on the stock exchange: deposits, apartments, loans, etc.
Users have access to a variety of convenient features in the portfolio.
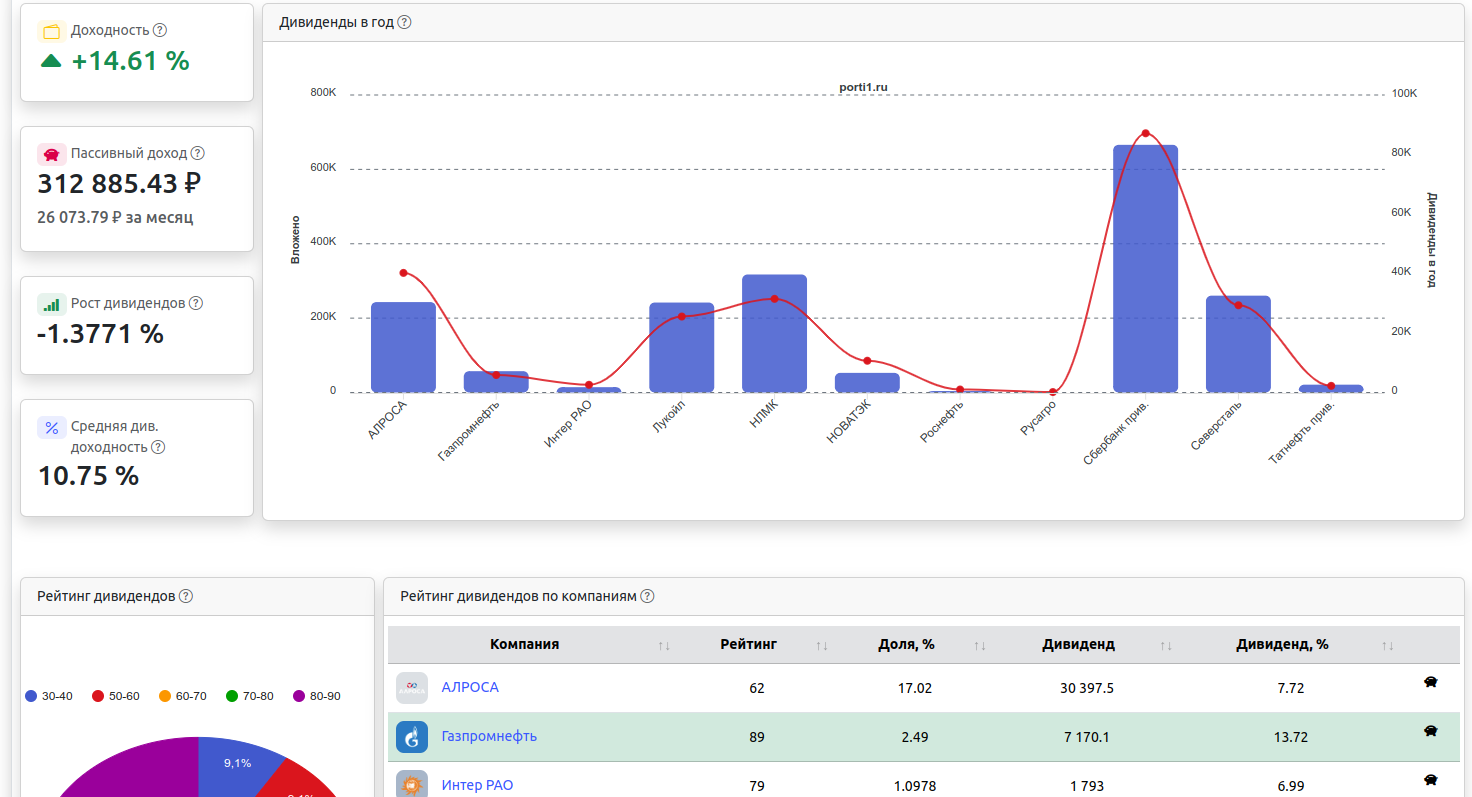
Dividend Analysis
Full dividend analytics with payment schedules and quality of issuers in the portfolio.
-
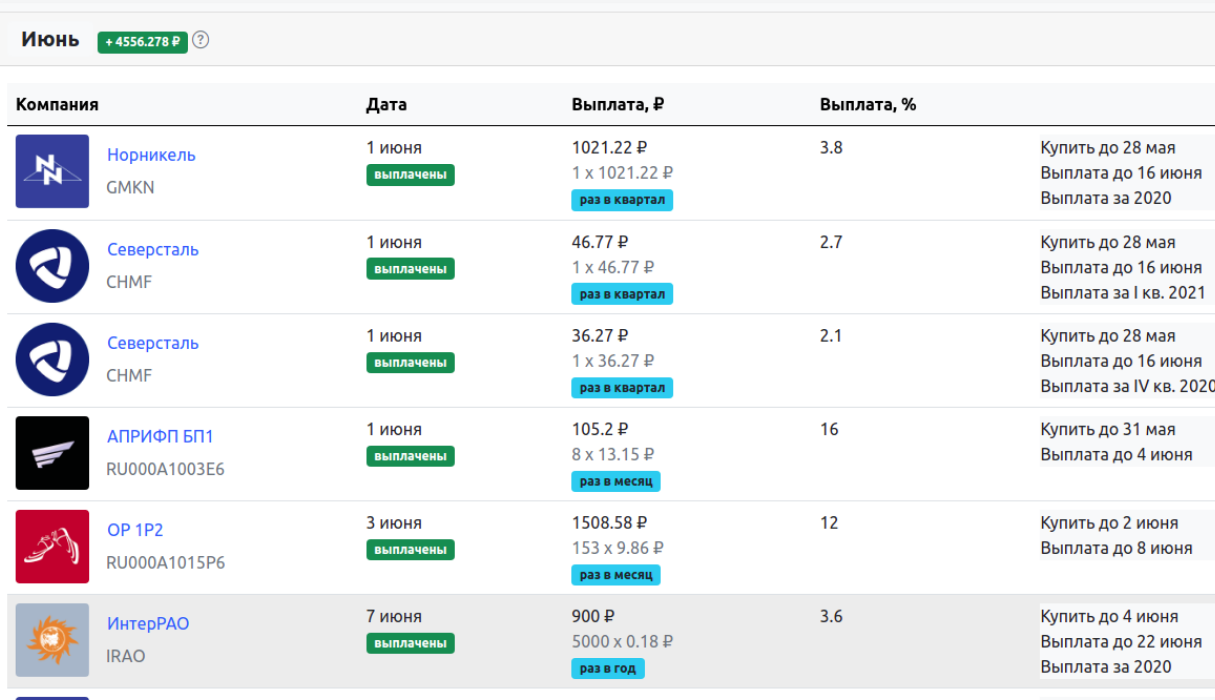
Payment calendar
Dividend payment calendar and performance of each company in the portfolio.
-
Dividend Rating
Evaluation of the company's financial condition and payment history.
-
Increase in payments
Viewing the growth potential of each company's payouts, as well as the sector as a whole.
Dividend calendar
Payment calendar with forecast of future payments and calculation of passive income.
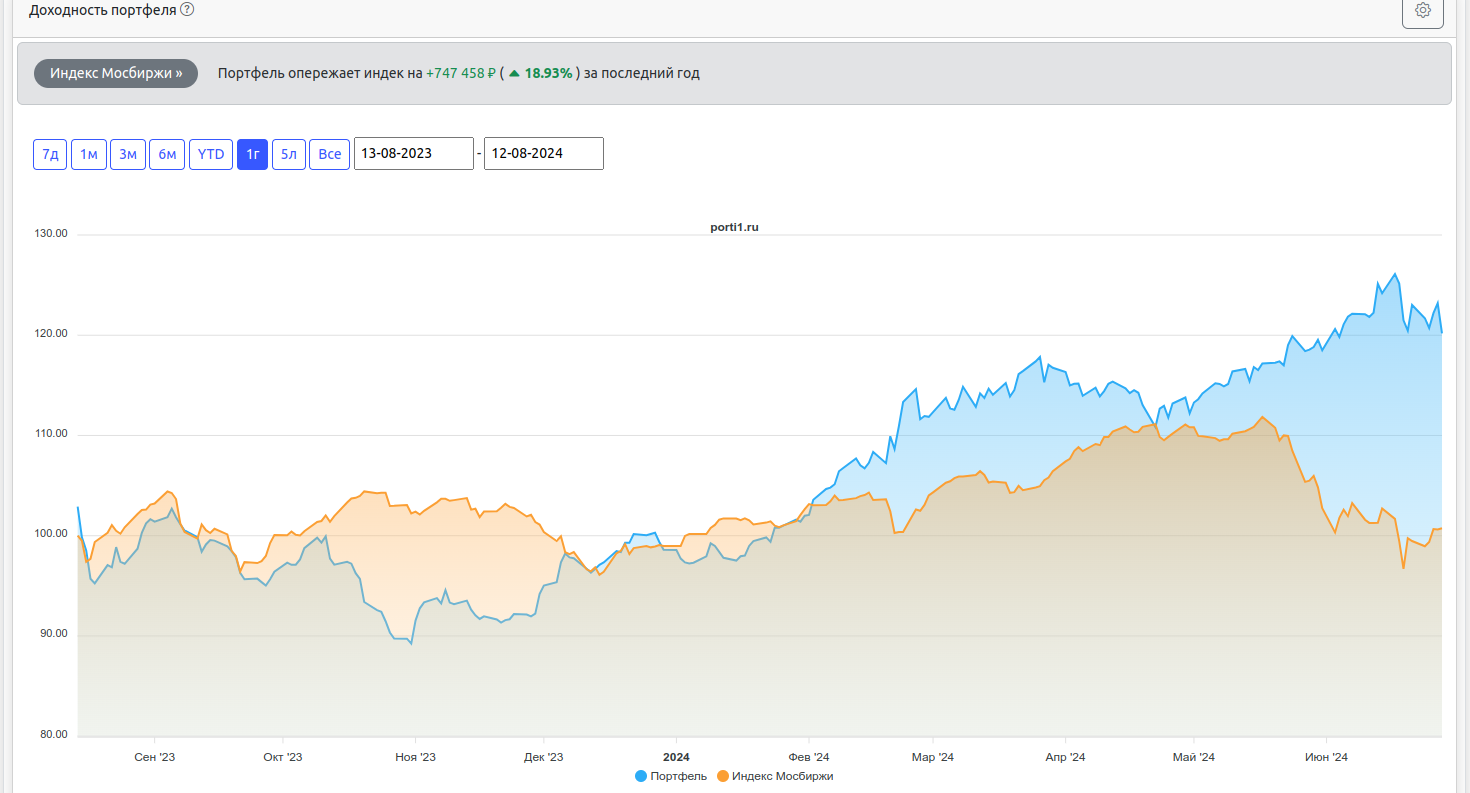
Portfolio analysis
Analysis of the portfolio for all issuers included in it, their profitability and growth potential.
-
Comparison of returns with indices
Compare returns with indices or any other asset.
-
Showing the most profitable assets
Ability to view the most profitable assets and categories in the portfolio.
-
Portfolio Yield Maps
A wide variety of charts for analyzing the most profitable investments.
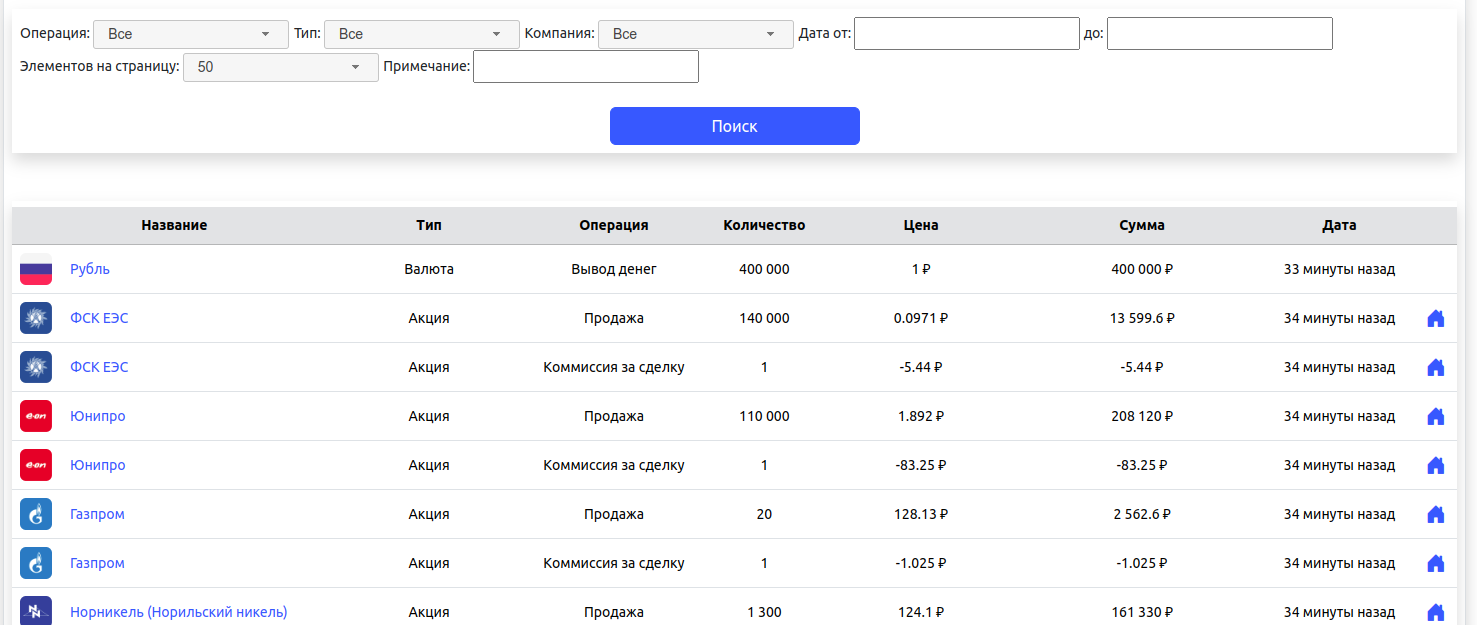
All transactions
List of all portfolio transactions including coupon and dividend payments.
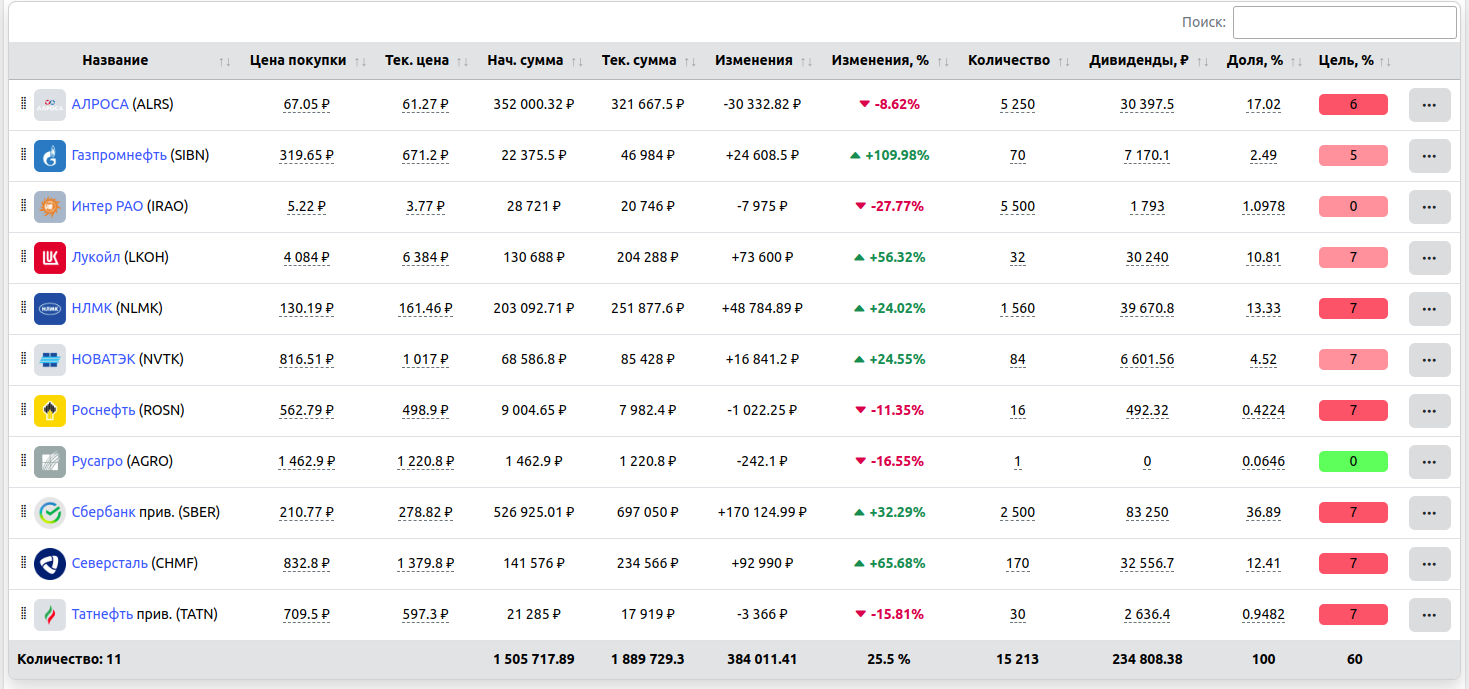
List of assets
List of assets with growth rates and current shares.
-
Show all papers in the portfolio
Display of all assets in the portfolio, their shares and the profitability of each.
-
Accounting for paid commissions and taxes
For each security, you can see the costs of taxes and commissions, as well as other income and expenses on them.
-
Setting target values
Setting the required share for each security for convenient adherence to the intended purchase goals.